- Top
- Seminar list
- Now you too are a black belt! Site Analysis / Improvement Fukahori Dojo-This is the essence of Web marketing.
Now you too are a black belt! Site analysis / improvement Fukahori Dojo
-This is the essence of Web marketing-Get all the numbers you can get-
~ Seminar Report ~
Seminar outline
theme
Now you too are a black belt! Site analysis / improvement Fukahori Dojo
-This is the essence of Web marketing-Get all the numbers you can get-
Place
1-14-6 Dogenzaka, Shibuya-ku, Tokyo Humax Shibuya Building 10F
Teacher
[Part 1] GMO Payment Gateway, Inc. Innovation Partners Division Customer Attraction Support Department Analysis Analyst Yasuhito Takahata
[Part 2] GMO Payment Gateway, Inc. Innovation Partners Division Customer Attraction Support Department Data Scientist Yu Sugawara
Overview
Focusing on site analysis and improvement,
- I want to improve the site, but I don't know the bottleneck
- I want to use Google Tag Manager
- I can't see the data I want to see in Google Analytics
We hold seminars for companies that have such concerns.
In the first part, we will explain from the methodology of finding the bottleneck of the site to the concrete method of solving it.
In the second part, we introduced an analysis method that goes one step further, from an overview of tag managers and data layers to how to use them.
[Part 1] Find the bottleneck of the site! -From finding improvement points to hints for solving them-
① How to think and find a bottleneck
At the beginning, I explained what a bottleneck is, and that improving the poor flow will lead to an improvement in the flow of the entire site.
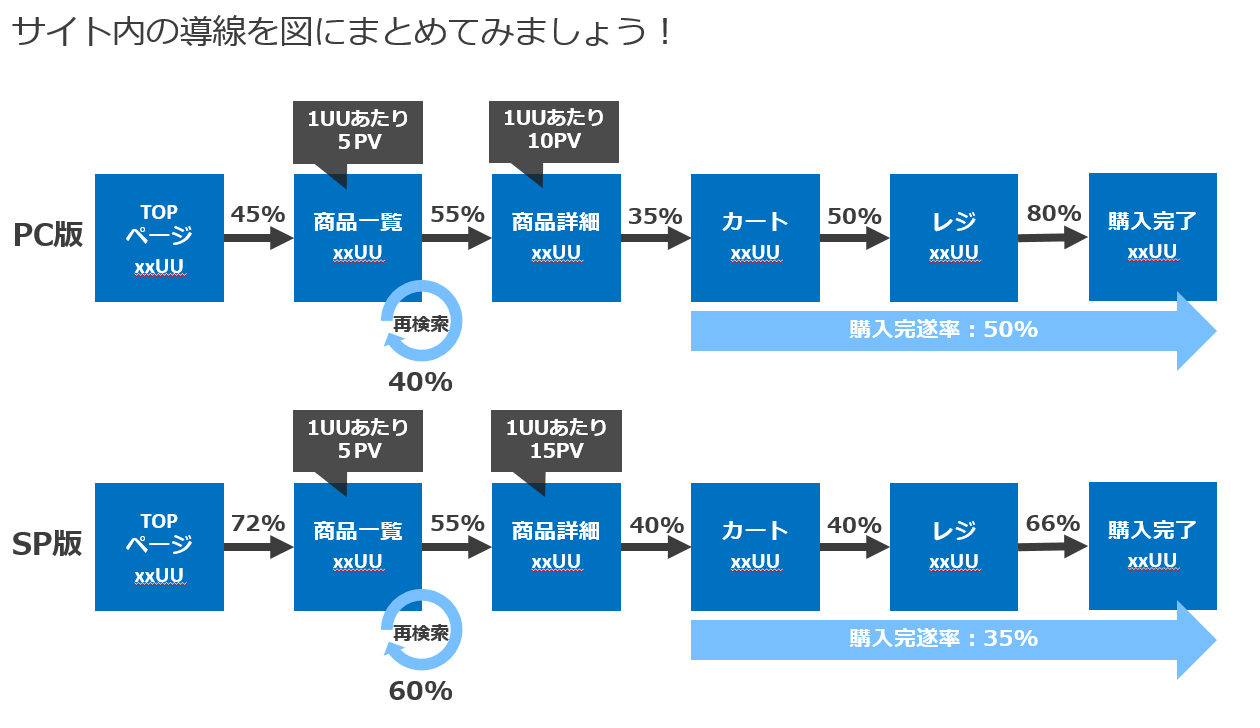
Regarding how to find bottlenecks on the site, we explained the points of bottlenecks with high priority while conducting a workshop using the site lead diagram.
② About the site conductor diagram
Next, I introduced three tools as a way to create a site conductor diagram.
- Google Analytics (Goal Achievement Process)
- Google Analytics (Sequence Segment)
- Google data studio
He also explained not only the setting flow of each, but also the advantages and disadvantages.
③ How to find issues on the screen
Next, while introducing the points on how to find issues on the site screen, I explained by giving examples to think about improvement measures.
The points are the following three points.
- Use the site with the feelings of the user and think about what is difficult to use
- Compare with the competition
- Think about how it can be more convenient
[Part 2] Freely dig deep data measurement with the tag manager! -The one who controls the data layer controls the analysis-
① What is Google Tag Manager Data Layer?
At the beginning, I introduced that Tag Manager and Data Layer are tools that solve problems such as time and cost that occur during data planning.
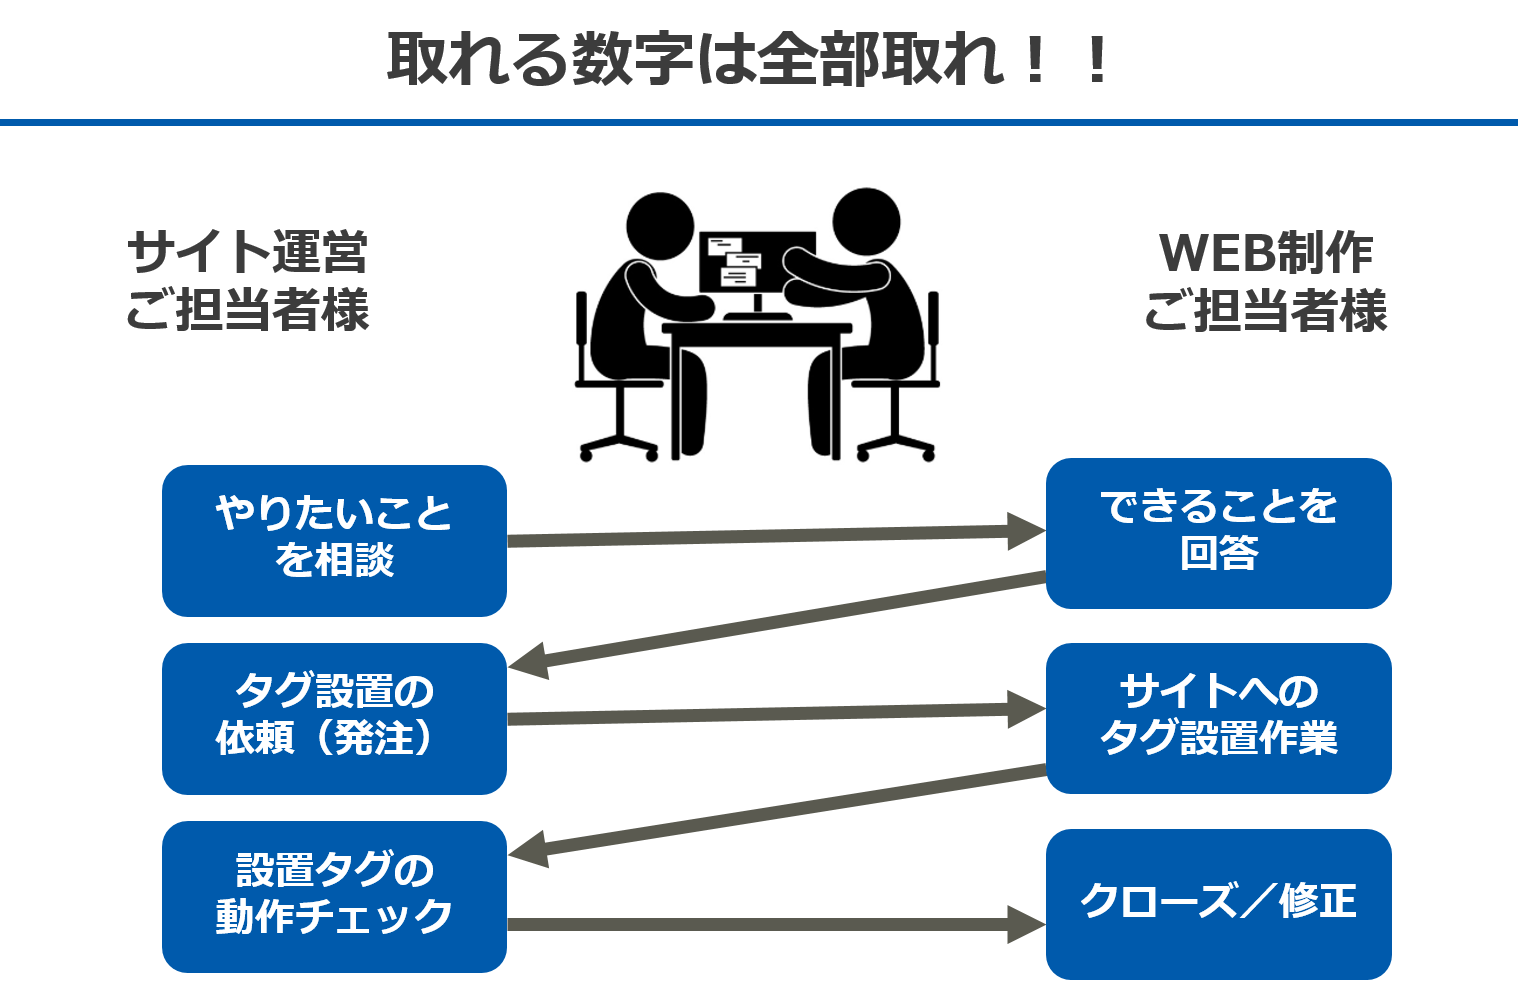
However, he emphasized that in order to introduce analytics, the code needs to be installed "appropriately", and in order to do so, the person in charge of site operation and the person in charge of web production must cooperate in data planning.
(2) How to introduce and utilize tag manager (with case studies)
Next, I explained the important points for each data planning flow.
- Consult what you want to do
After looking at the site from the visitor's point of view, centering on the phrase "no analysis without hypothesis", make hypotheses such as "is navigation used?" And "is the inquiry lead functioning?" He emphasized the importance of installing tags. - Tag installation request
He explained that it is important to clarify what kind of action you want to measure on the site when requesting tag installation, using a caricature that says "what the customer really needed".
In addition, the following cases were introduced as examples of site improvement using tag manager.
- Measurement of utilization of recommendations and favorite functions (apparel site)
- Measurement of purchase rate for each product (kids / baby products sales site)
- Visualization of contract contributions by content (travel reservation site)
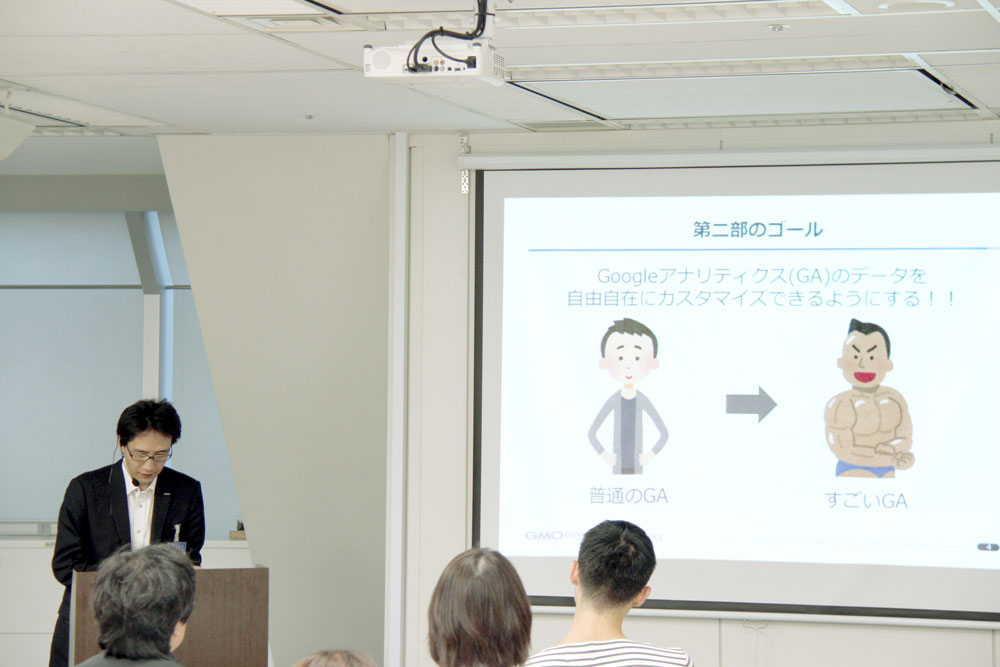
③ Google Analytics that goes one step further
Finally, the seminar was closed by introducing the functions that can be freely customized on analytics.
- Top
- Seminar list
- Now you too are a black belt! Site Analysis / Improvement Fukahori Dojo-This is the essence of Web marketing.
This service is applicable when the introduced EC site is operated by a corporation.
If the introductory EC site is operated by an individual, please check here.

