- Top
- Seminar list
- [For EC sites] Google Analytics Super Practical Seminar-Seminar Report
[For EC sites] Google Analytics super-practical seminar
Just by correctly visualizing the data, the issues of the site can be seen at a glance
~ Seminar Report ~
Seminar outline
theme
[For EC sites] Google Analytics super-practical seminar
-Just by correctly visualizing the data, the issues on the site can be seen at a glance-
Place
1-14-6 Dogenzaka, Shibuya-ku, Tokyo Humax Shibuya Building 7F
Teacher
Yu Sugawara, Data Scientist, Customer Attraction Support Department, Innovation Partners Division GMO Payment Gateway, Inc.
Kiiro Co., Ltd. Representative Director Masahiko Yukihiro
Symmetric Co., Ltd. Yasuko Suzuki
Overview
The theme is [Google Analytics], a tool that can analyze sites.
・ I want to improve the site using Google Analytics
・ I can't analyze correctly because I haven't set it.
・ I want to make the data easier to see and find site issues easily.
We hold seminars for those in charge who have problems such as.
In the first part, as a basic part, we explain the items that should be set on the EC site.
In the second part, we will explain the method for increasing sales of EC sites while demonstrating the visualization tool "ANATOMY" of Google Analytics.

【Part One】
At the beginning, I mentioned the importance of initializing Google Analytics.
It is important to "make and test hypotheses" before analyzing with Google Analytics, and proper initial settings are essential before that. If the initial settings are inadequate, correct data cannot be obtained, and "correct hypothesis testing" for improving sales / profit cannot be performed, which is a dangerous situation that leads to incorrect judgment.
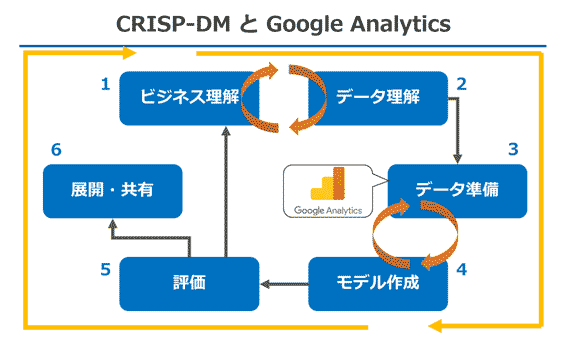
Explained using the CRISP-DM process model to explain the overall picture of data analysis.
- 1. Business understanding
Make various hypotheses from industry and industry. - 2. Data understanding
Understand which data is needed to verify what was hypothesized in process 1. - 3. Data preparation
This process is an important point. Set up Google Analytics to get the data required in 2.
If you make a mistake here, you will not be able to measure the correct data.
Next, I explained four important items that should be set especially on the EC site.
- 1. Goal setting
- 2. E-commerce settings
- 3. User attributes
- 4. Site search
In addition, we will introduce the setting mistakes and precautions that we often see.
He reported that there were cases where tags were erased due to site renewal, and there were cases where tag installation was omitted due to the effect of requesting site production from multiple production companies.
Finally, the following contents were explained as a summary of the first part, and the first part was completed.
・ First of all, it is important to make a "hypothesis"
・ Initial setting is very important to measure correct data
・ Repeat the PDCA cycle to formulate and verify hypotheses
[Part 2]
At the beginning, he explained the important viewpoints when analyzing and the behavioral characteristics of users that should be suppressed.

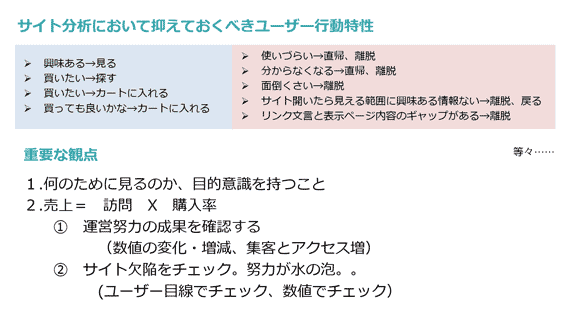
He also mentioned that it is important to go back to the user's point of view and look at the site, and then check the increase and decrease of the numerical values, make a hypothesis, and think deeply.
In the second half, we will demonstrate using the ANATOMY screen. As a verification to increase the purchase rate, we took the correct effect measurement on the special page as an example.
The important thing on the special page is the design of the first view, and it is necessary to be aware of the following two points.
-The moment the user opens the page, he or she decides whether it is relevant to him or not, whether he wants to see it or not.
-Even if it is created with effort / cost, the user will leave if there is no content to convey.
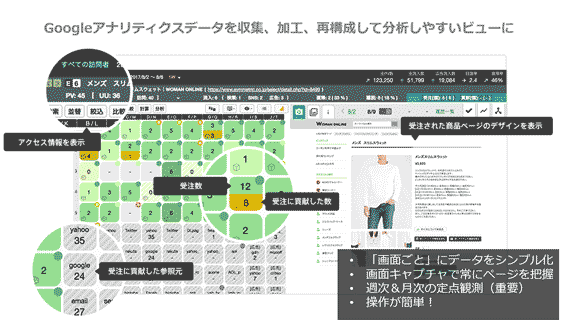
One of the attractions of ANATOMY is that you can check the page capture on the analysis screen. He introduced that for the person in charge who cannot intuitively judge the above points from the user's point of view even by looking only at the numerical values, it leads to early detection of problems and is very pleased.
Finally, the seminar was closed with the following explanation as a summary of the second part.
・ Analysis of EC site does not last long if you suddenly try to see a lot of things
⇒ ANATOMY's visualized screen makes it easy to check data and find bottlenecks.
・ Let's review the settings of Google Analytics
⇒Mistaken settings are fatal and should be dealt with immediately.
- Top
- Seminar list
- [Beginner] Dramatically improve CVR with smartphone optimization that can be done with free tools! --Seminar report
This service is applicable when the introduced EC site is operated by a corporation.
If the introductory EC site is operated by an individual, please check here.

