Financial Highlights(Consolidated)Financial Highlights(Consolidated)
(As of the fiscal year ending September 2025)
Financial Highlights(Consolidated)
| IFRS-based | Fiscal Year Ended September 2021 (28th period) |
Fiscal Year Ended September 2022 (29th term) |
Fiscal Year Ending September 2023 (30th period) |
2024年9月期 (第31期) |
2025年9月期 (第32期) |
|---|---|---|---|---|---|
| Sales revenue (Millions of yen) |
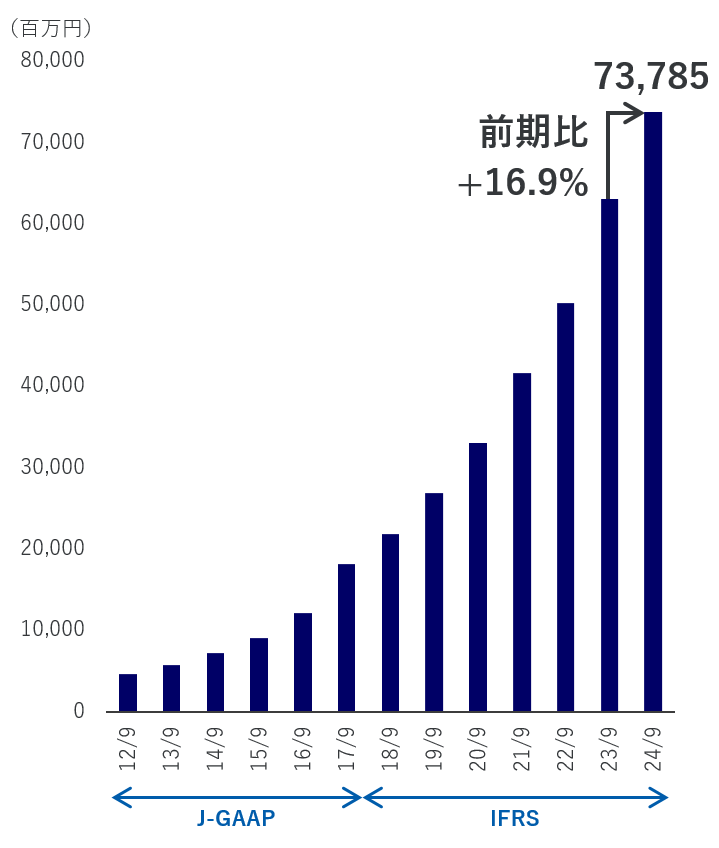
41,667 | 50,298 | 63,119 | 73,785 | 82,499 |
| operating profit (Millions of yen) |
12,987 | 16,249 | 20,312 | 25,187 | 31,340 |
| assets Total (Millions of yen) |
215,455 | 273,407 | 292,346 | 344,702 | 406,800 |
| Total Capital (Millions of yen) |
57,820 | 89,260 | 94,804 | 105,819 | 116,177 |
| Equity attributable to owners of the parent | 25.9% | 31.9% | 31.6% | 29.9% | 27.8% |
| ROA (assets Total pre-tax profit margin) |
6.5% | 14.2% | 7.3% | 8.6% | 8.5% |
| ROE (Profit on equity attributable to owners of the parent company) |
20.1% | 33.8% | 15.0% | 19.2% | 20.2% |
Sales revenue
operating profit
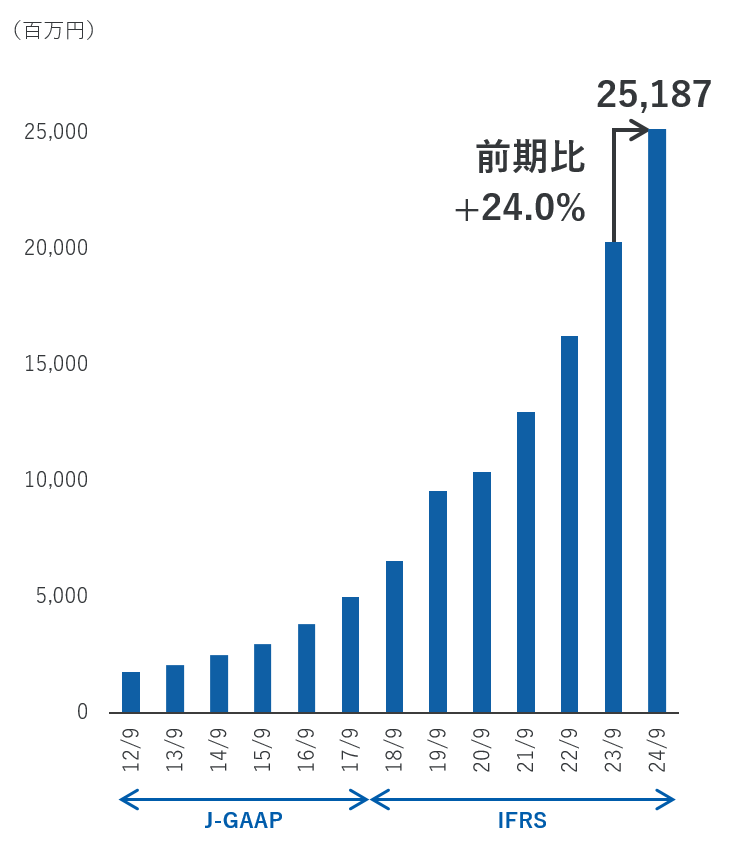
* Due to the deconsolidation of MACROKIOSK in the fiscal year ended September 2020, the revenue and operating profit figures for sales are for continuing operations excluding discontinued operations.
* International Financial Reporting Standards (IFRS) have been applied since the fiscal year ended September 2018. In addition, in the fiscal year ended September 2017, the results were reclassified and displayed in accordance with IFRS standards.
Data Books
(2025年9月期 時点)


(As of FY2025)
Financial Highlights(Consolidated)
| IFRS | FY2021 | FY2022 | FY2023 | FY2024 | FY2025 |
|---|---|---|---|---|---|
| Revenue (Million JPY) |
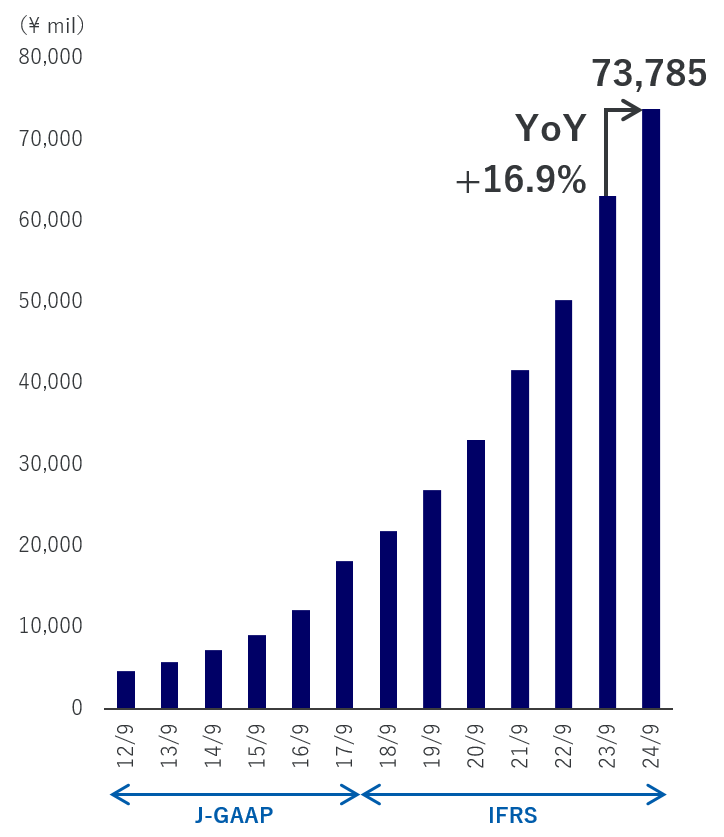
41,667 | 50,298 | 63,119 | 73,785 | 82,499 |
| Operating profit (Million JPY) |
12,987 | 16,249 | 20,312 | 25,187 | 31,340 |
| Total assets (Million JPY) |
215,455 | 273,407 | 292,346 | 344,702 | 406,800 |
| Total equity (Million JPY) |
57,820 | 89,260 | 94,804 | 105,819 | 116,177 |
| Total equity attributable to owners of parent to total assets |
25.9% | 31.9% | 31.6% | 29.9% | 27.8% |
| ROA (Return on Assets using profit before income taxes) |
6.5% | 14.2% | 7.3% | 8.6% | 8.5% |
| ROE (Return on equity using Profit attributable to owners of parent) |
20.1% | 33.8% | 15.0% | 19.2% | 20.2% |
Revenue
Operating Profit
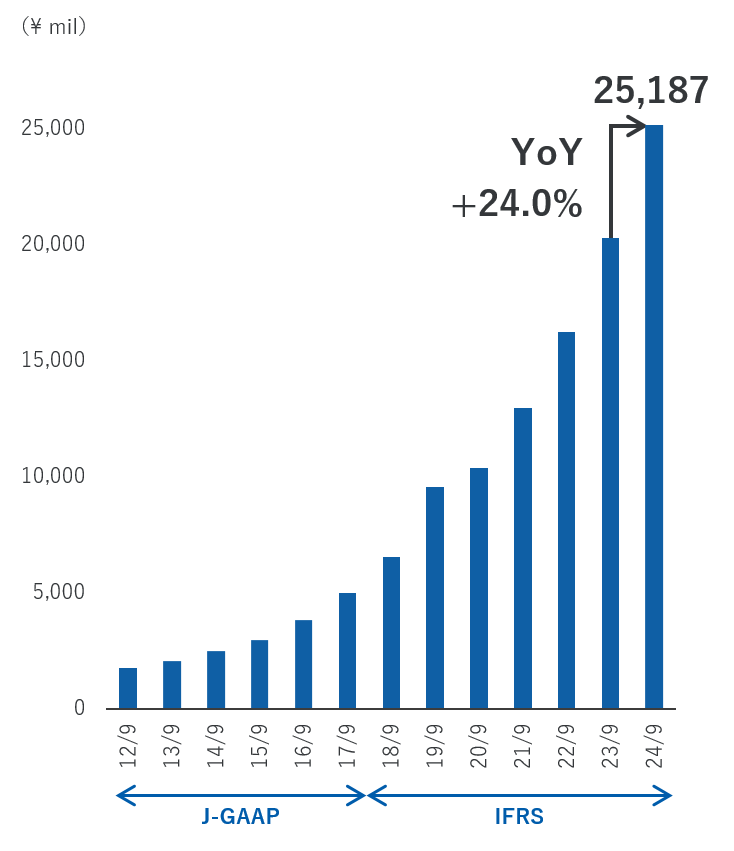
* Due to the deconsolidation of Macro Kiosk Berhad in FY2020, its business has been reclassified as a discontinued operation. As a result, the figures for revenue and operating profit only represent the amounts for continuing operations. The figures for FY2019 have been similarly restated.
* IFRS standards have been adopted from FY2018, and the figures for FY2017 are restated on the same basis.
Data book
(As of FY2025)
VIEW
If you have any questions or consultations about our services, please contact us.
Please feel free to contact us from the following.