


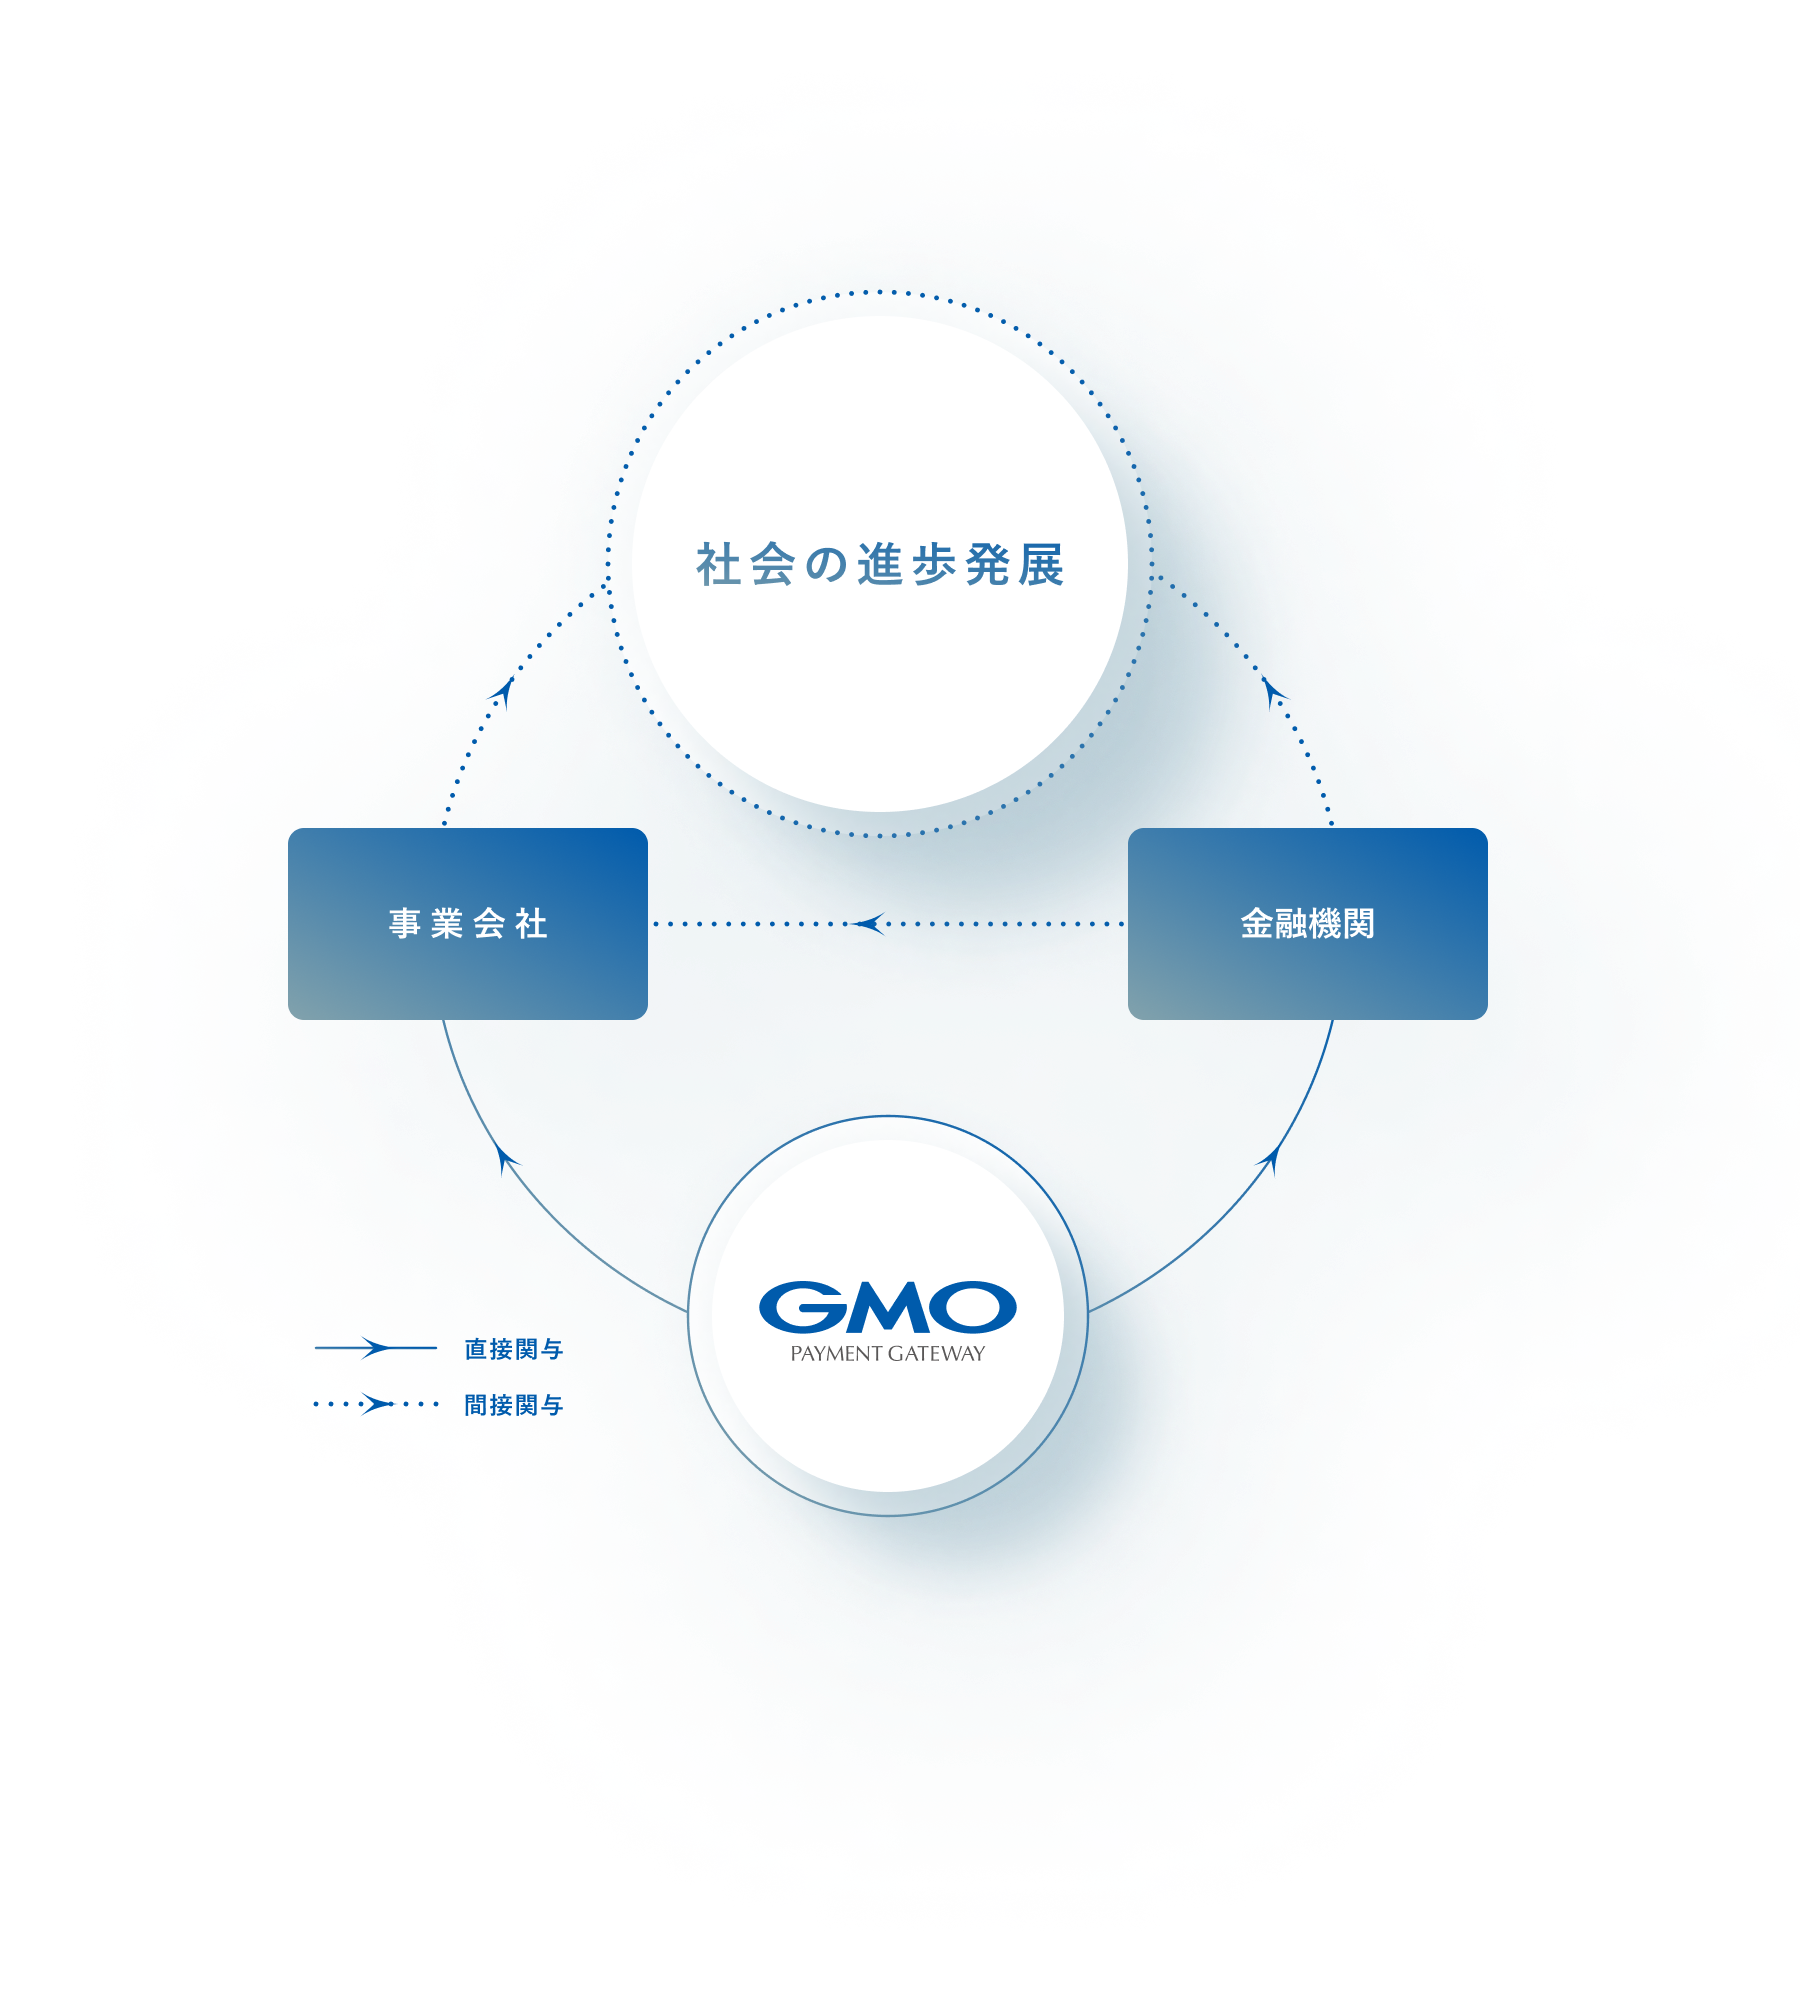
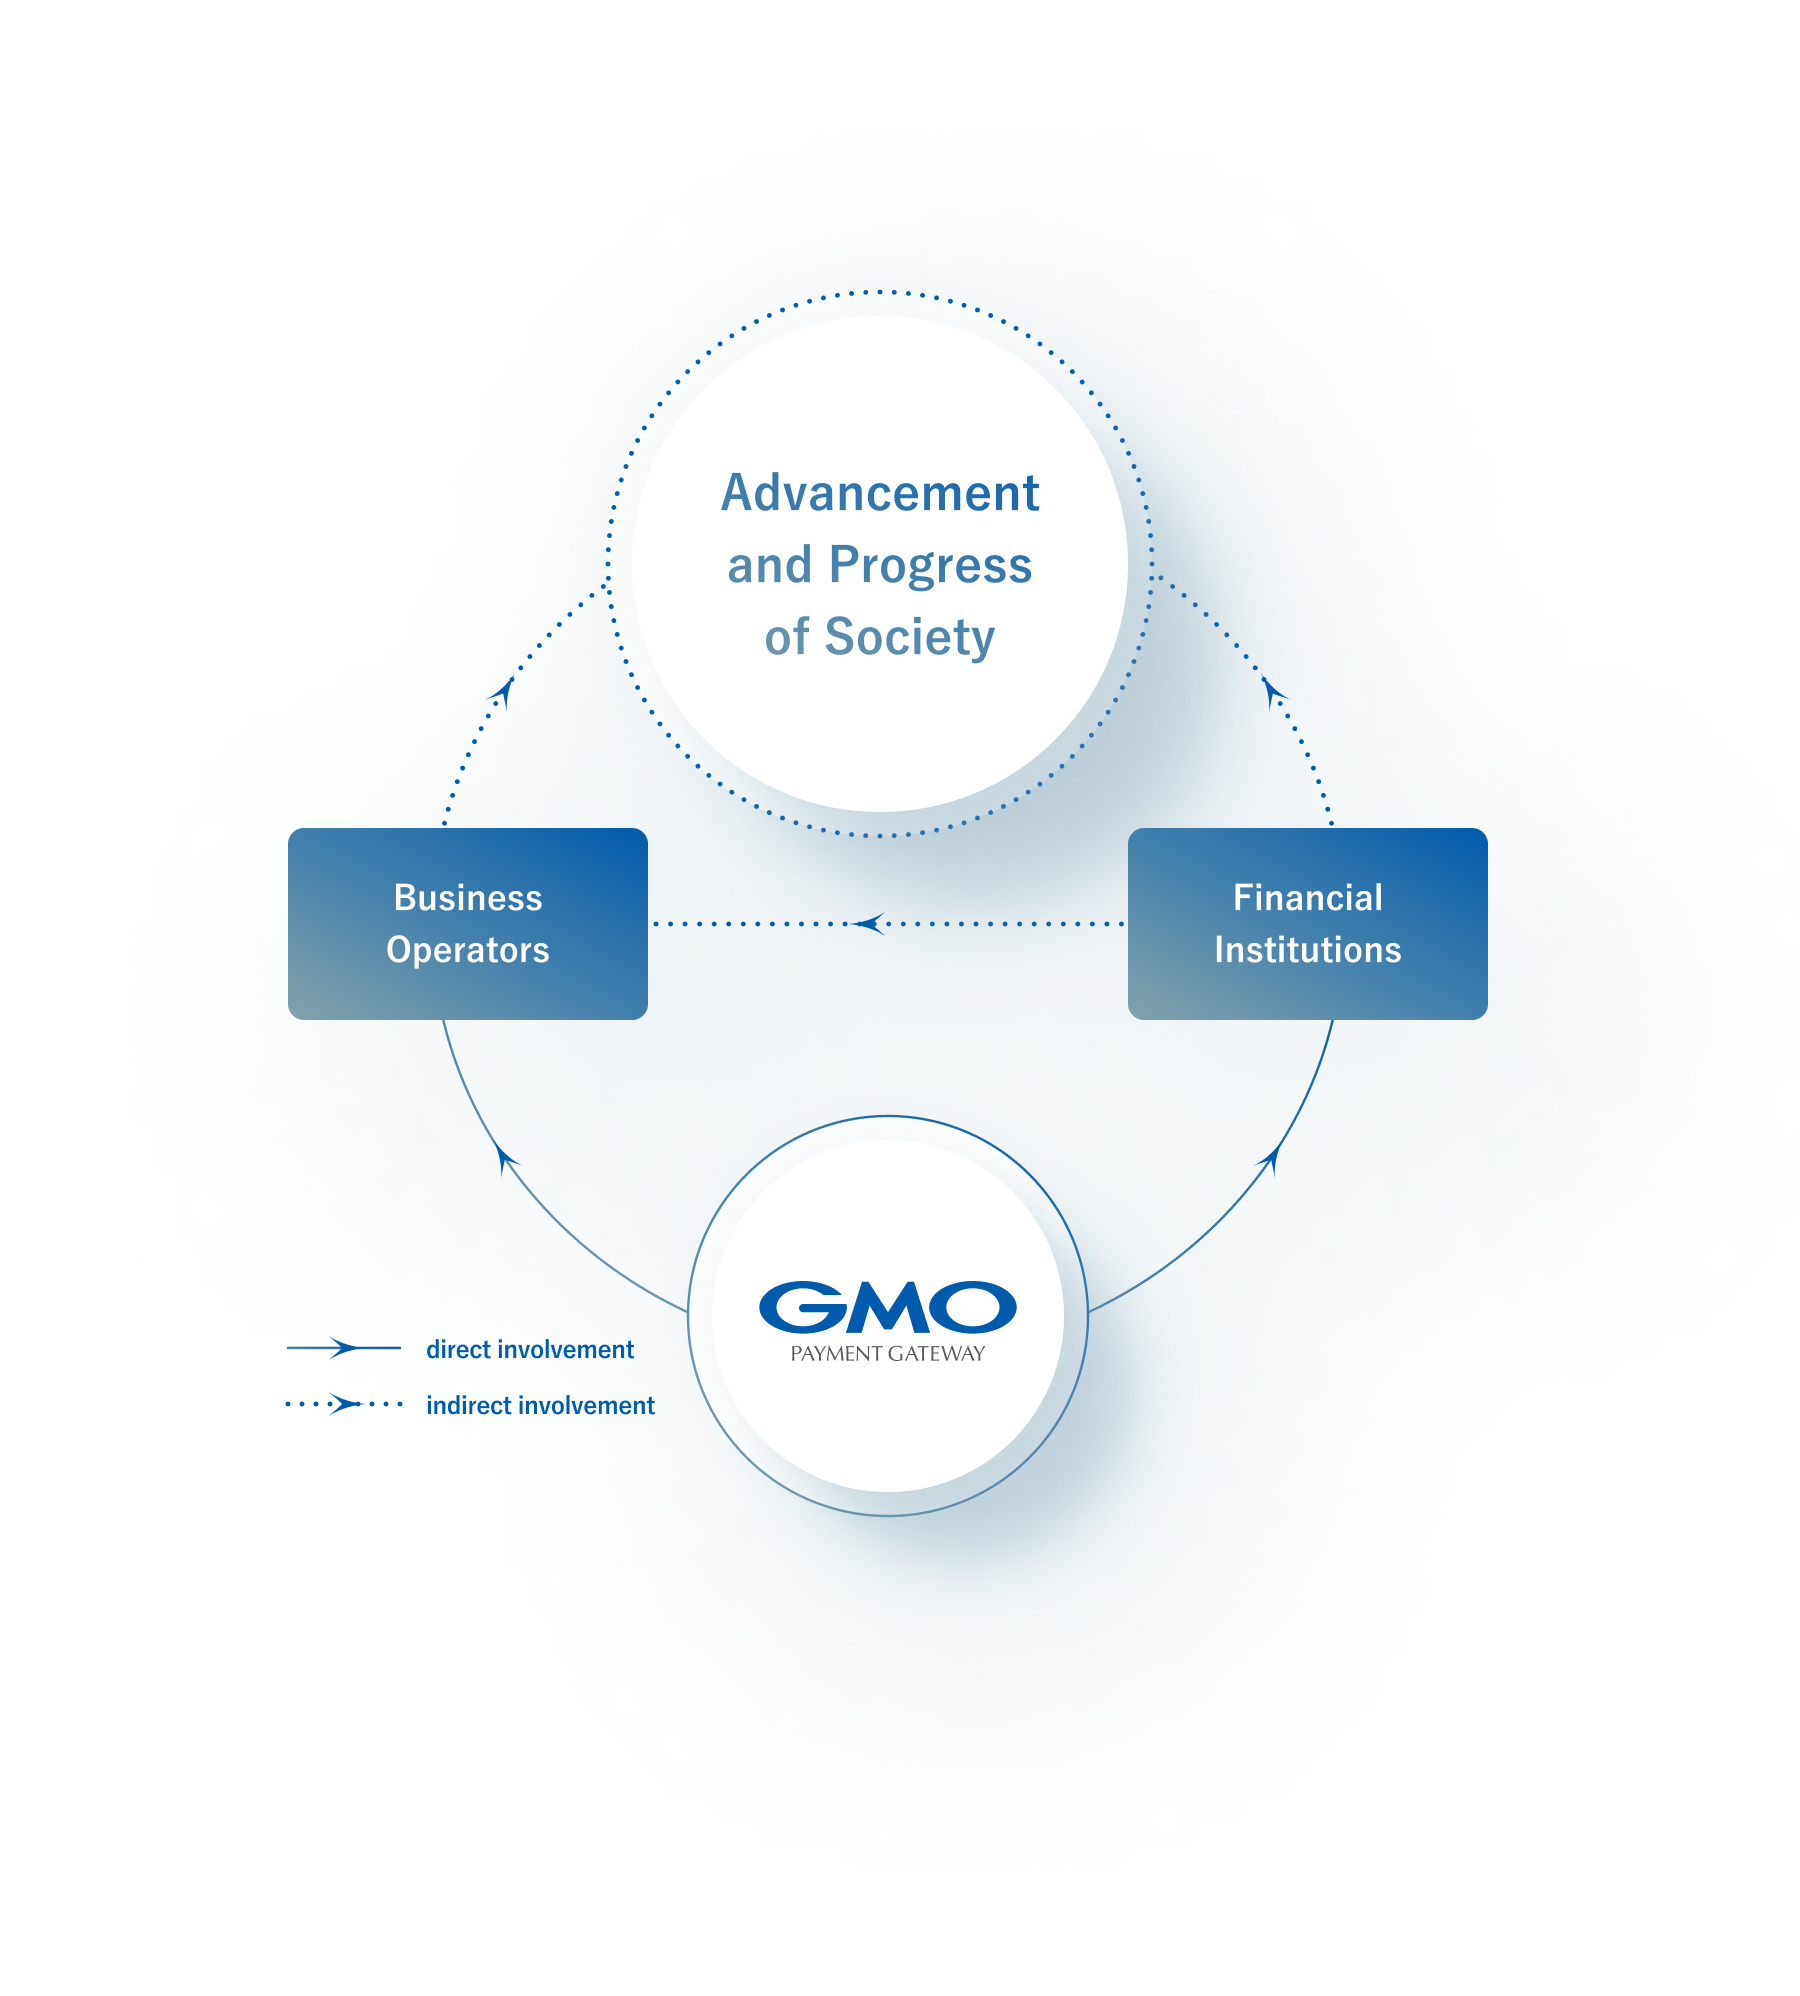
決済で、
次をつくる。
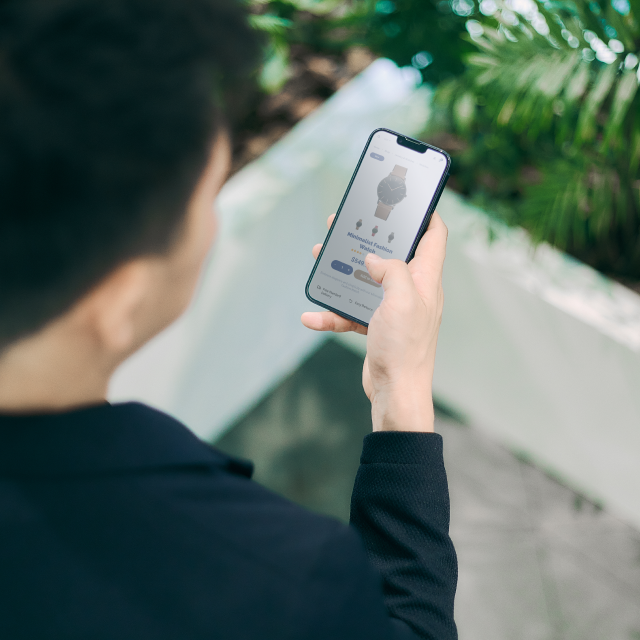
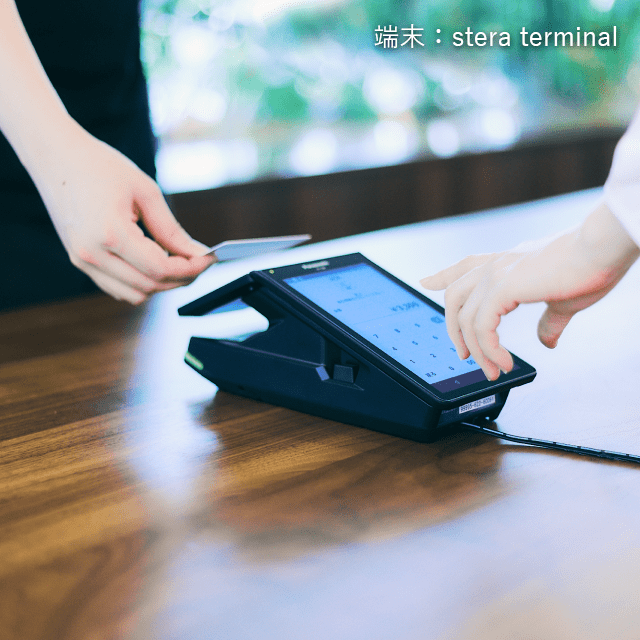
お金の流れをデジタル化し、
もっと便利で、もっと可能性あふれる社会へ。
新しい夢、新しいビジネス、新しいサステナブル。
決済はつくる、想像以上の未来を。
SCROLL


OWNED MEDIA あなたのとなりに決済を
-
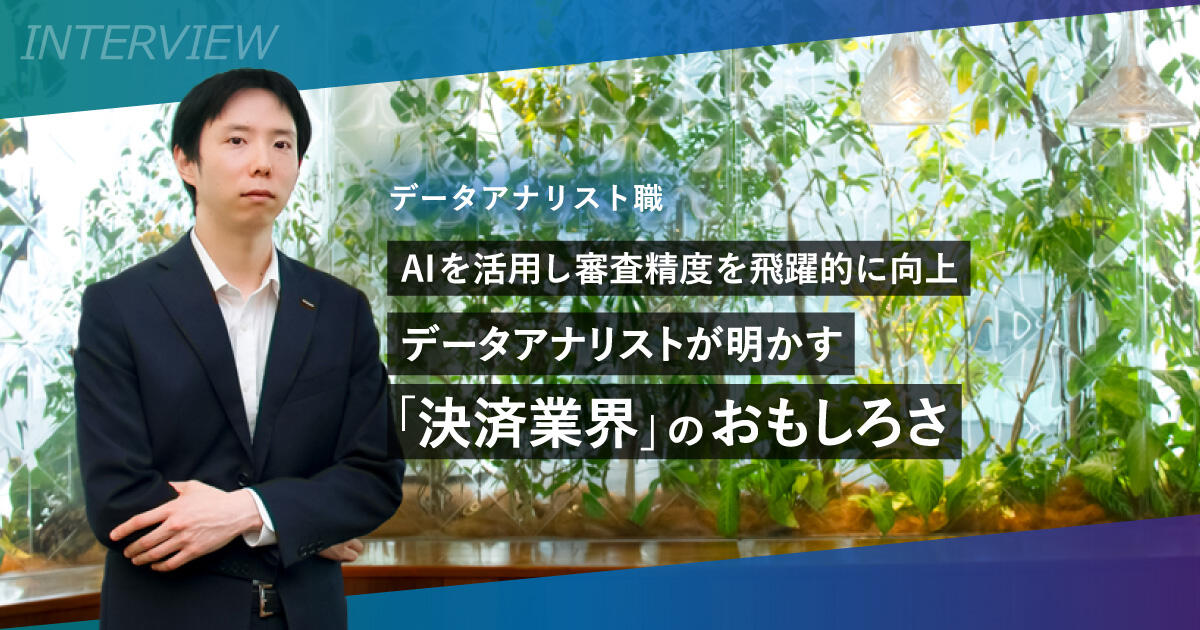 AI データアナリスト職 後払い
AIを活用し審査精度を飛躍的に向上―データアナリストが明かす「決済業界」のおもしろさ
-
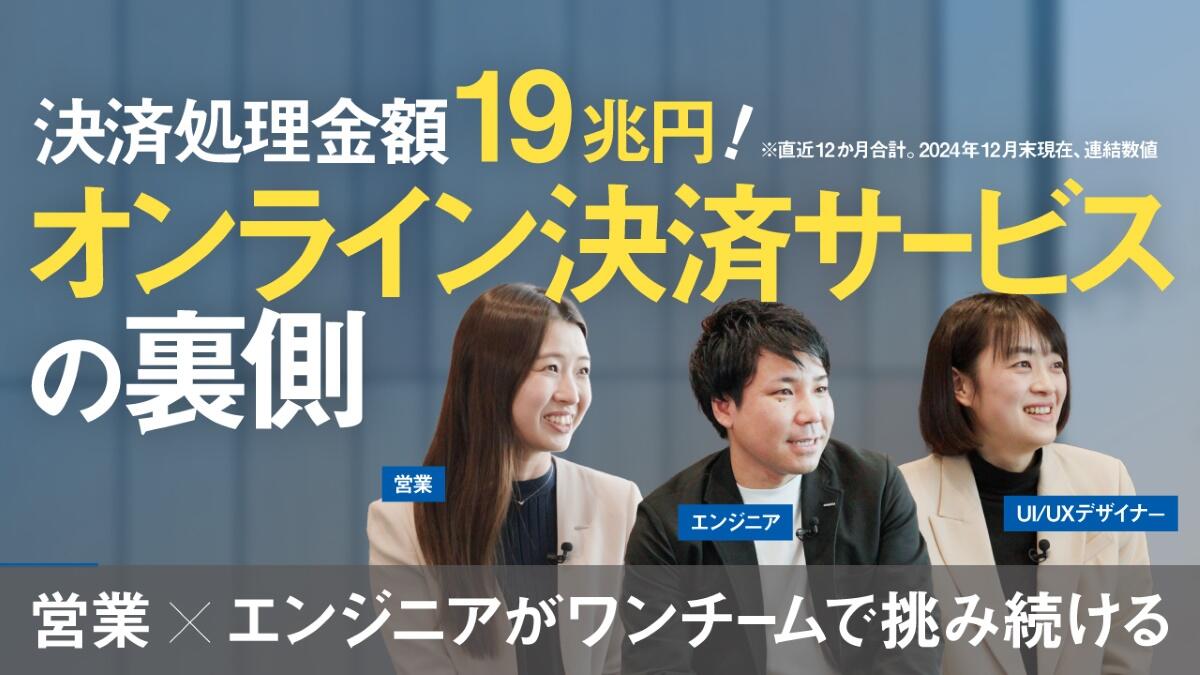 PGマルチペイメントサービス エンジニア職 デザイナー職 営業職 座談会
決済インフラを支える3職種のリアル─営業・エンジニア・UI/UXデザイナーの連携と成長
-
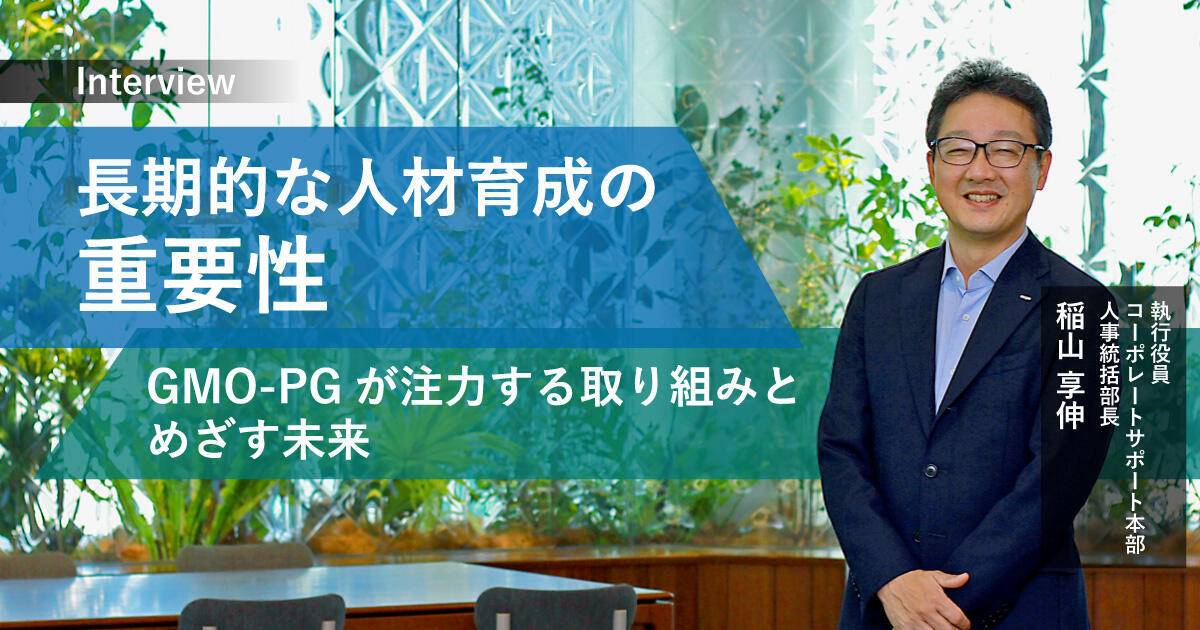 インタビュー 人事 研修
長期的な人材育成の重要性──GMO-PGが注力する取り組みとめざす未来
-
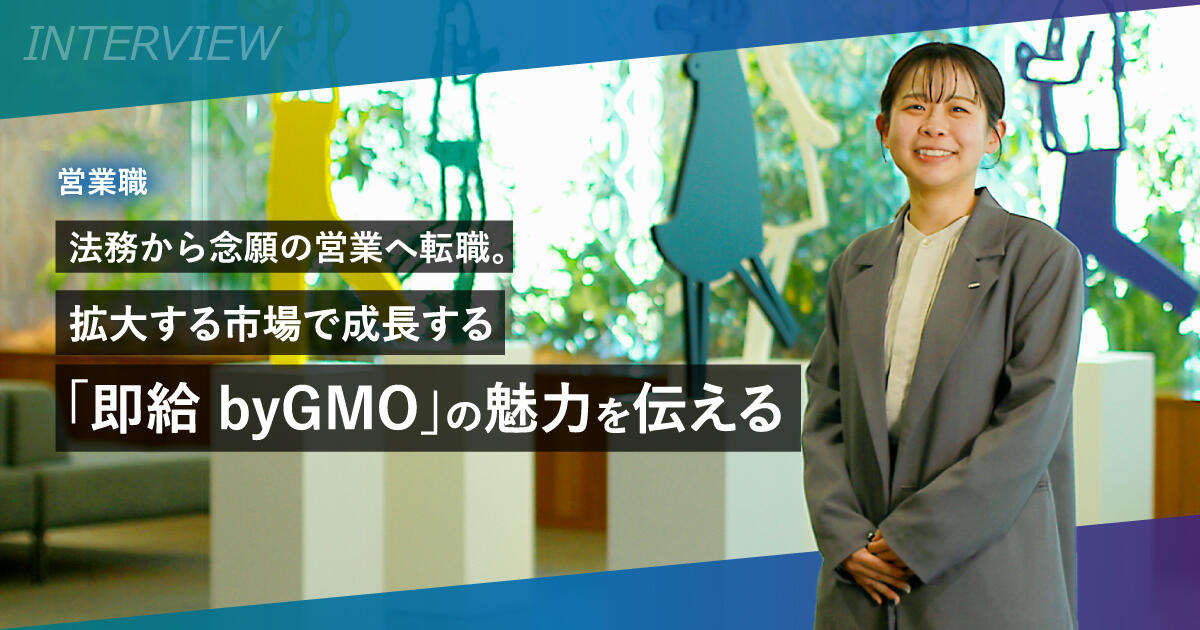 インタビュー 中途 即給 byGMO 営業職 新規事業
法務から念願の営業へ転職。拡大する市場で成長する「即給 byGMO」の魅力を伝える
-
 ESG インタビュー カーボンクレジット
GMO-PGの自然資本への貢献 -森林由来クレジット創出の現場を訪問-
INQUIRY お問合せ
メディア関連やパートナープログラム関連、サービスについてなど
各種お問い合わせはこちらから