連結財務ハイライトFinancial Highlights(Consolidated)
(2025年9月期時点)
連結財務ハイライト
| IFRSベース | 2021年9月期 (第28期) |
2022年9月期 (第29期) |
2023年9月期 (第30期) |
2024年9月期 (第31期) |
2025年9月期 (第32期) |
|---|---|---|---|---|---|
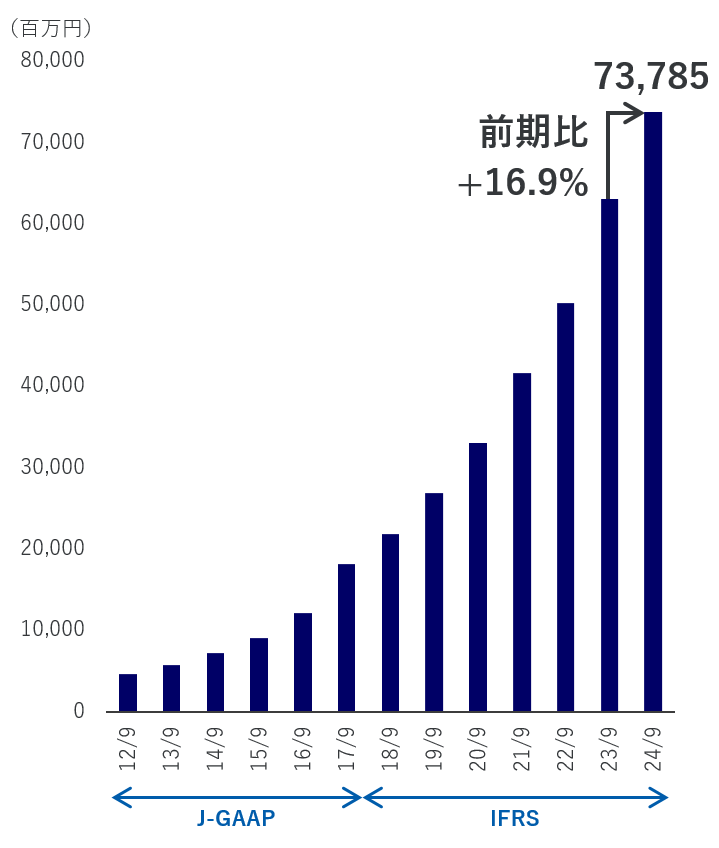
| 売上収益 (百万円) |
41,667 | 50,298 | 63,119 | 73,785 | 82,499 |
| 営業利益 (百万円) |
12,987 | 16,249 | 20,312 | 25,187 | 31,340 |
| 資産合計 (百万円) |
215,455 | 273,407 | 292,346 | 344,702 | 406,800 |
| 資本合計 (百万円) |
57,820 | 89,260 | 94,804 | 105,819 | 116,177 |
| 親会社所有者帰属持分比率 | 25.9% | 31.9% | 31.6% | 29.9% | 27.8% |
| ROA (資産合計税引前利益率) |
6.5% | 14.2% | 7.3% | 8.6% | 8.5% |
| ROE (親会社所有者帰属持分当期利益率) |
20.1% | 33.8% | 15.0% | 19.2% | 20.2% |
売上収益
営業利益
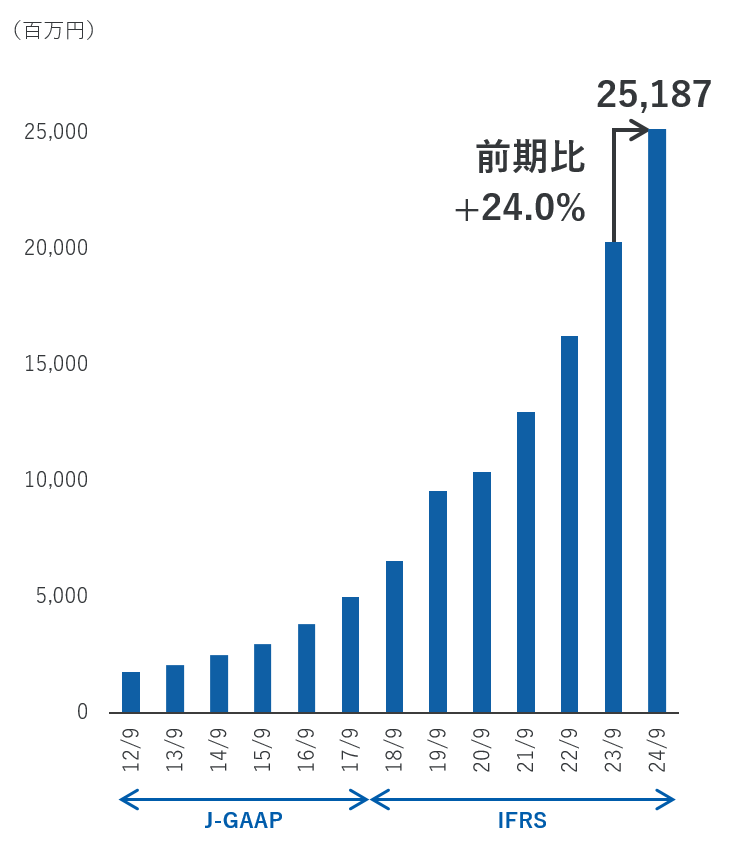
* 2020年9月期にMACROKIOSK社が連結除外されたため、売上収益、営業利益は非継続事業を除いた継続事業の金額を表示しております。
* 2018年9月期より国際会計基準(IFRS)を適用しております。また、2017年9月期もIFRS基準に組み替えて表示しております。
データブック
(2026年9月期 第2四半期時点)


(As of FY2025)
Financial Highlights(Consolidated)
| IFRS | FY2021 | FY2022 | FY2023 | FY2024 | FY2025 |
|---|---|---|---|---|---|
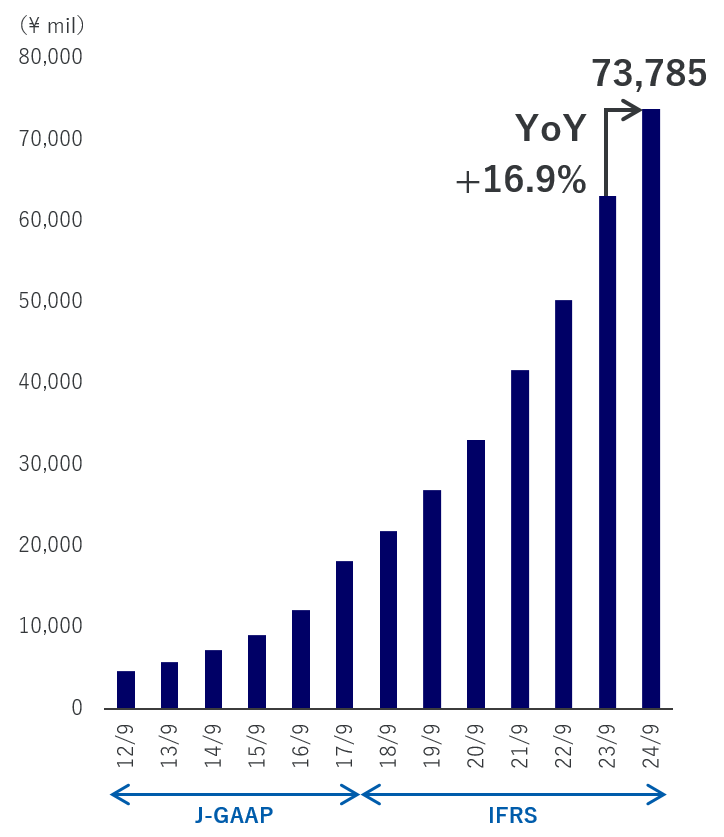
| Revenue (Million JPY) |
41,667 | 50,298 | 63,119 | 73,785 | 82,499 |
| Operating profit (Million JPY) |
12,987 | 16,249 | 20,312 | 25,187 | 31,340 |
| Total assets (Million JPY) |
215,455 | 273,407 | 292,346 | 344,702 | 406,800 |
| Total equity (Million JPY) |
57,820 | 89,260 | 94,804 | 105,819 | 116,177 |
| Total equity attributable to owners of parent to total assets |
25.9% | 31.9% | 31.6% | 29.9% | 27.8% |
| ROA (Return on Assets using profit before income taxes) |
6.5% | 14.2% | 7.3% | 8.6% | 8.5% |
| ROE (Return on equity using Profit attributable to owners of parent) |
20.1% | 33.8% | 15.0% | 19.2% | 20.2% |
Revenue
Operating Profit
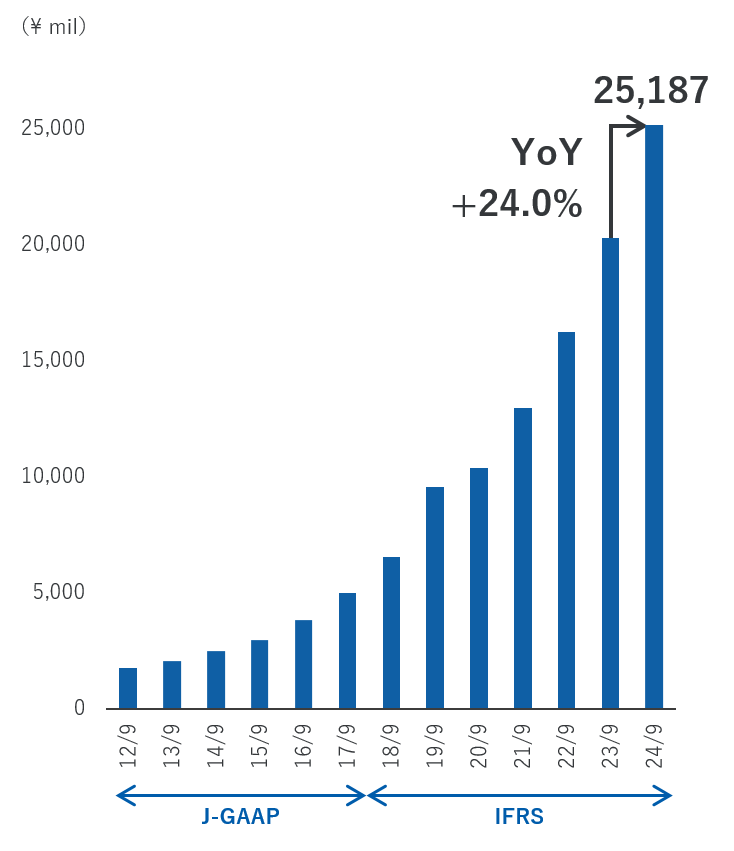
* Due to the deconsolidation of Macro Kiosk Berhad in FY2020, its business has been reclassified as a discontinued operation. As a result, the figures for revenue and operating profit only represent the amounts for continuing operations. The figures for FY2019 have been similarly restated.
* IFRS standards have been adopted from FY2018, and the figures for FY2017 are restated on the same basis.
Data book
(As of Q2 of FY2026)
VIEW
サービスについての質問・相談は
下記よりお気軽にお問い合わせください。